|
Slide 12 of 21 First Previous Next Last Index |

|
|
Slide 12 of 21 First Previous Next Last Index |

|
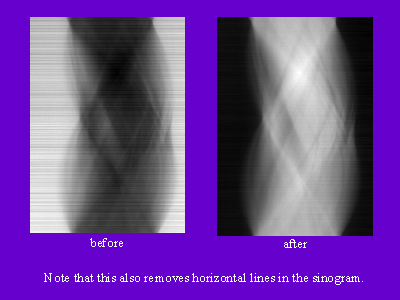
You can see in the uncorrected sinogram on the left that on the left and the right edges there is some space where the beam does not pass through the sample. We use the values here to find the initial intensity by averaging a few pixels from the left and a few from the right. We do this for each row individually because the overall intensity varies between angles (as you can see by the horizontal lines in the sinogram), and this removes these lines as well.