Reconstruction and Viewing of Microtomography Bone Samples
Aaron Rendahl, Bethel College
University of Washington REU Program, Summer 1999
X-ray microtomography, commonly known as computerized axial tomography or CAT scans, has been performed on bone samples of different animals, including pelican, antelope, and emu, to see the three-dimensional structure of the bone. Especially of interest are the internal Haversian canals, which contain blood vessels, nerves, and a variety of other cell types that depend on the canal's age. The initial projection data has been reconstructed using improved software and processed to allow both viewing of slice-by-slice movies using Shockwave Flash and three-dimensional virtual reality viewing using the Virtual Reality Modeling Language (VRML). We also hope to obtain a graph representation of the Haversian network to analyze how it changes as the animals age.
1. Method of Tomography Reconstruction
To perform x-ray microtomography, an x-ray beam is passed through a sample and the resulting x-ray pattern is recorded. This can be used to find how much of the x-ray beam has been absorbed by the sample. More images are recorded while rotating the sample from 0 to 180 degrees, resulting in a set of images from all around the sample. It can be proved mathematically (Webb, 108-110) that these images are enough to reconstruct a three dimensional picture of the bone, but this is beyond the scope of this more practical document. There are several methods of implementing the mathematical solution, but the most common, and the one that will be used here, is that of convolution and backprojection. In this method, each vertical slice is processed individually. Simply put, the data is first convolved (or filtered) with one of several possible edge detecting filters, and then the information from each angle is backprojected into a image space and summed.
In practice, this simple procedure is complicated by many practical factors, and the original images must be processed before the image can be reconstructed. First, the x-ray beam is not uniform throughout, nor is the room free of other x-ray sources, so a white field (a picture of only the beam, with no sample) and a dark field (a picture with no beam) must be obtained and used to cancel out these effects using the formula
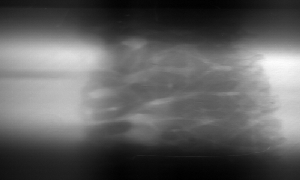 Figure 1. An original image. |
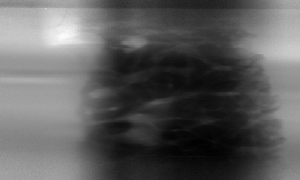 Figure 2. A corrected image. |
Each vertical slice is then reconstructed individually. First, a sinogram containing all the data collected about a specific slice is constructed by putting the data from each projection angle into a single row of a new image. The initial data must then be converted from a beam to an apparent thickness of the sample. This is done using Beer's expression for beam attenuation (Webb, 99).
where I0 is calculated separately for each row by averaging a certain number of pixels to the left and to the right of the sample, where the beam could pass unattenuated to the detector. This I0 can then be used for each point in that row to calculate the apparent thickness. Calculating it separately also solves the problems that each projection may not have the same initial intensity, that is, there will appear to be horizontal lines in the sinogram. Compare Fig. 3 and Fig. 4.
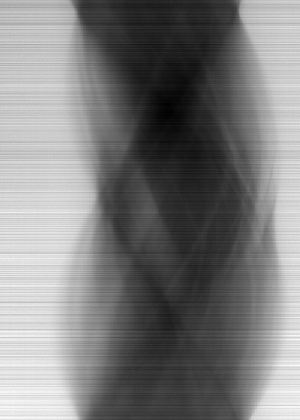 Figure 3. An original sinogram. Note the horizontal lines. |
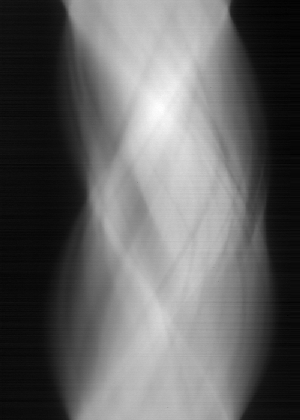 Figure 4. A fixed sinogram. The horizontal lines are gone. |
These sinograms must now be processed further to remove or minimize potential artifacts that can be caused by inconsistencies in the initial data. The two main artifacts are half-circles around features of the sample and full circles around the center of the reconstruction. The half circles are due to the fact that the rotation axis of the sample is not directly lined up with the center of the beam, resulting in the center of the sinogram being off. The center must be found, and the sinogram moved over the proper amount. Since the projection at 0 degrees and at 180 degrees should contain the same data except reversed, these two rows of the sinogram can be used to find the center by finding the same features on both and calculating the average of their values. Usually several features are tried and an average used.
The full circles surrounding the center of the reconstruction are due to vertical lines in the sinogram, which can be due to bad detector elements, among other things. The simplest way to remove these lines is simply to wash them out by smoothing each row out by a certain number of pixels. Although this can result in slightly less defined reconstructions, this is usually outweighed by the removal of the more obvious rings.
Finally, each row of the sinogram is filtered with a Shepp-Logan filter to emphasize the edges, and each angle's data is backprojected into the reconstruction.
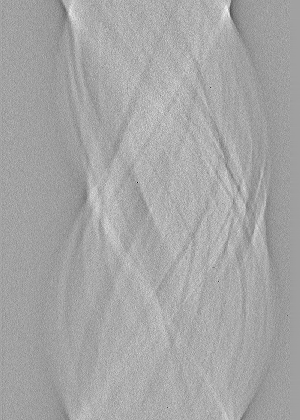 Figure 5. A filtered sinogram. |
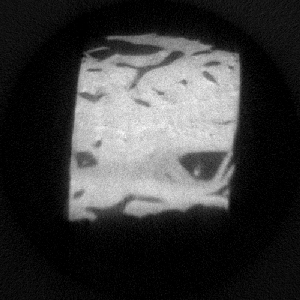 Figure 6. A reconstructed image. |
2. Reconstruction Improvements
Previously, reconstruction was done in LabView using Fortran libraries, and took between thirty and sixty Pentium hours for large data sets. After rewriting the code in IDL, the time was shortened to ten to twenty Pentium hours, a factor of three improvement. The new code also is able to better remove the concentric rings mentioned earlier. Much thanks is due to Mark Rivers for his earlier work on tomography in IDL.
We also experimented with parallel processing, with the hope of sharing the processing load between many computers during the night and on weekends. A very simple parallel processing technique seems best, that of running the same code with different data on the multiple machines. Using an implementation of the Message Passing Interface (MPI), which allows computers to simply send messages back and forth between each other, we plan to use one computer as a master, and the rest as slaves. The master will have a list of the slices that need to be processed and farm them out to the other machines one by one. When a machine finishes a slice, it will simply be assigned a new one. In this simple way, the reconstruction time can be greatly reduced by a factor equal the number of computers available, minus the master.
Complicating this is that in order to run the software on machines without IDL, it must be rewritten in C (or another language that can be compiled to directly run on PC's). Unfortunately, part of IDL's speed gains result from hard-coded matrix operations, which cannot be duplicated with standard C. Some functions will have to be written using assembly code, which preliminary tests show to be faster than C by a factor of three for simple matrix operations, or perhaps by using optimized libraries from Intel. These libraries have not been tested yet.
3. Viewing of the Data
After the data was reconstructed, it was processed for creation of slice-by-slice movies and virtual reality viewing. To make the slice-by-slice movies, the data was cropped to a region of interest and thresholded from both above and below to remove extraneous noise and maximize the range of the useful data. Bitmaps were then created of each slice in each direction, which were then imported into Shockwave Flash to create the movies. See a sample slice-by-slice movie MPEG here (1 MB).
Of more interest is the virtual reality viewing of the bone structure. This is achieved by modeling an isosurface of the bone volume with polygons. These polygons are described by a set of points and a set of lists detailing which points are members of the polygons, and these sets can be simply output into Virtual Reality Modeling Language (VRML). VRML is an open Internet standard, and browsers are available for all platforms and all web browsers. It allows for the bone samples to be viewed three dimensionally and rotated at will so that the structure can be seen from any possible angle or viewpoint, including viewpoints inside the sample. See Figure 7 for a screenshot, or click here to see a bone sample containing web-like canals (264K gzipped), or here for another interesting sample (271K gzipped).
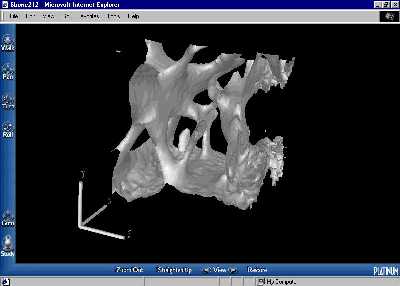 Figure 7. A VRML representation of a bone sample, viewed in Worldview 2.1 in Internet Explorer. |
Using these viewing techniques on the new tomographic data have allowed for new discoveries about the structure of the Haversian canal. For example, it has been discovered that in some plexiform bone, the canals are found to be in web-like planes connected by occasionally perpendicular canals.
4. Analysis of the Bone Structure
Work on the analyzing the bone structure with a graph representation continues. Preliminary work on two-dimensional models is encouraging. In these models, the canals are thinned down to a single line, which is then analyzed to find the nodes (where three or more lines meet together), and their connectivity (which nodes directly contact which other nodes). Nodes are found by analyzing the neighbors around each point to see how many paths lead away from it, and the connections are found by following these paths away from each node until another node is reached. If these algorithms can be extended to three dimensions, a graph representation will quickly be reached.
5. Acknowledgements
Many thanks to my advisor Jerry Seidler, who helped me learn about tomography reconstruction and always had plenty of new ideas to try. Also to Gilbert Martinez, who worked on a parallel tomography problem this summer and helped me to learn IDL, and to Andy Hass, who provided initial help with MPI. Finally, to Wick Haxton and Martin Savage, directors of the Research Experience for Undergraduates (REU) program at the University of Washington, and the National Science Foundation, who funds the REU program.
References
Rivers, Mark. "Tutorial Introduction to X-ray Computed Microtomography Data Processing." Internet: "http://www-fp.mcs.anl.gov/xray-cmt/rivers/tutorial.html"
Webb, S. The Physics of Medical Imaging. Institute of Physics Publishing, Philadelphia: 1993.